четвер, 28 липня 2016 р.

How to predict price movement on FOREX?


When you see big rise without pullback, how to understand where price could be reversed? For this reason you should look at the bigger time frame. For example situation which happened today on EUR/USD (6E). Price grew till rebound from big volume of accumulation. 1.14 - is very important level which was accumulated during last years. And price reversed from it. If you trade intraday it was a good opportunity for you.


понеділок, 25 липня 2016 р.

How to use volumes accumulation and market profile? When you asked it it's mean that you understood that , most of different kind of EA and indicators don't work well. You are on the right track. Volumes and prices are pure information which we received from Exchanges. And we could use more effective then other information which are derivatives from the prices and/or volumes. How we can trade it? This is no so big secrets. You should mark  big areas of  volumes accumulation. And usually price is move from one area to another.

There are two kind of price condition. Balance and imbalance. When price has reached volume of accumulation they usually working with it and start building new balance zone. When zone of balance builded price go out from it  to another zone of balance where start built new zone. When you have know where located frontiers it is very easy to trade from them. You can put small stop loss and expect for bigger profit. There are few examples how we do it.


середа, 20 липня 2016 р.

My personal opinion on the different electronic advisors. How can you trust someone's advice, unless you know the essence of what is happening. Or if you do not understand how they work. What do gives you the information that you need to enter or leave? You will constantly doubt after a series of failures: it is just a series of failures or EA  has broken and doesn't work.  You need to understand the processes that occur in the market.

When you use market profile and volume analysis you can more understand about price behavior. Look at the example. This is 6E (EUR/USD) 20.07.2016. We see zone of accumulation of previous day. Price go down from it. And accumulate 2 local volumes  that lift price till yesterday's zone of accumulation. And price pullback from them. All clear. We see zone of accumulation. We see local splash of volumes and we know that price with high probability be pullback from the yesterday zone. All we have to do is find good point for entering. It is not a nuclear physics :) It's seems more easy when look with volumes.


вівторок, 19 липня 2016 р.

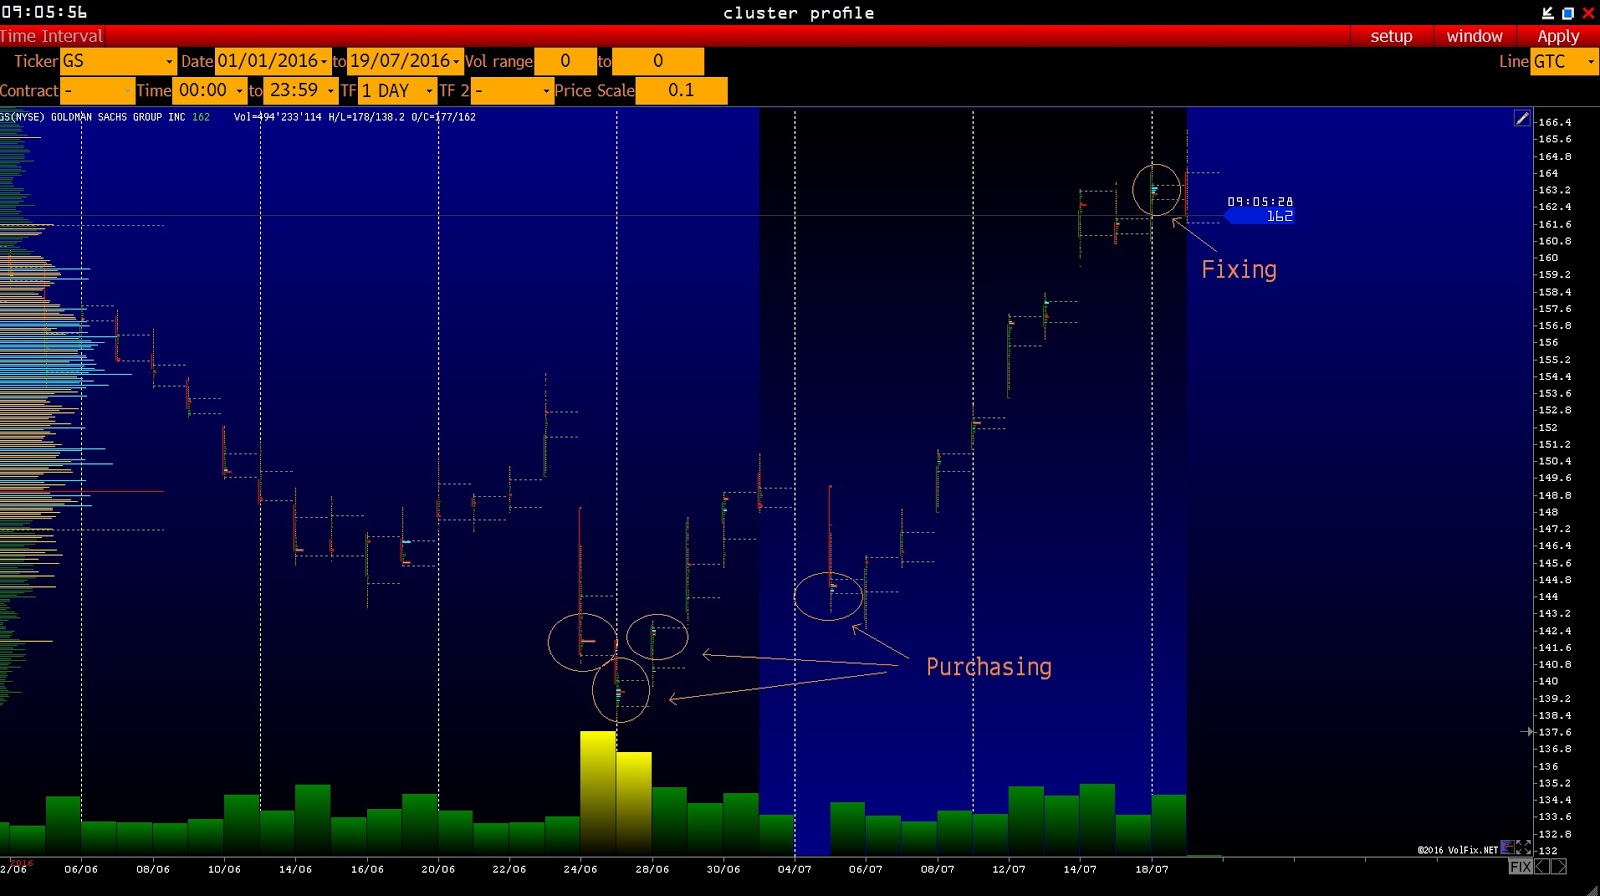
When you trade stocks or you are long-term investor there are a question when to buy? There are a few good answers: divide your capital and buy time to time or buy when price falling by several per cent. But for my opinion best time to by it is look at "smart money" or big participants of market. If they start purchasing do the same. How to identify big participants? It is very easy: they will buy a lot too many. If you have a trading program  which show you volumes, you can identify extra volumes on day charts.

Look at the picture below. It is Goldman Sachs. 24, 27, 28 of June we can see extra volumes on day chart and price grew up. 18 July before Reports Q2. Do you think that's a coincidence? Before reports someone big purchased on big volumes and push price up. And fixed part of profit before Report. Yes these just a game of daddy Cool :)
When you use market profile and volumetric analysis you  see this kind of game!


понеділок, 18 липня 2016 р.

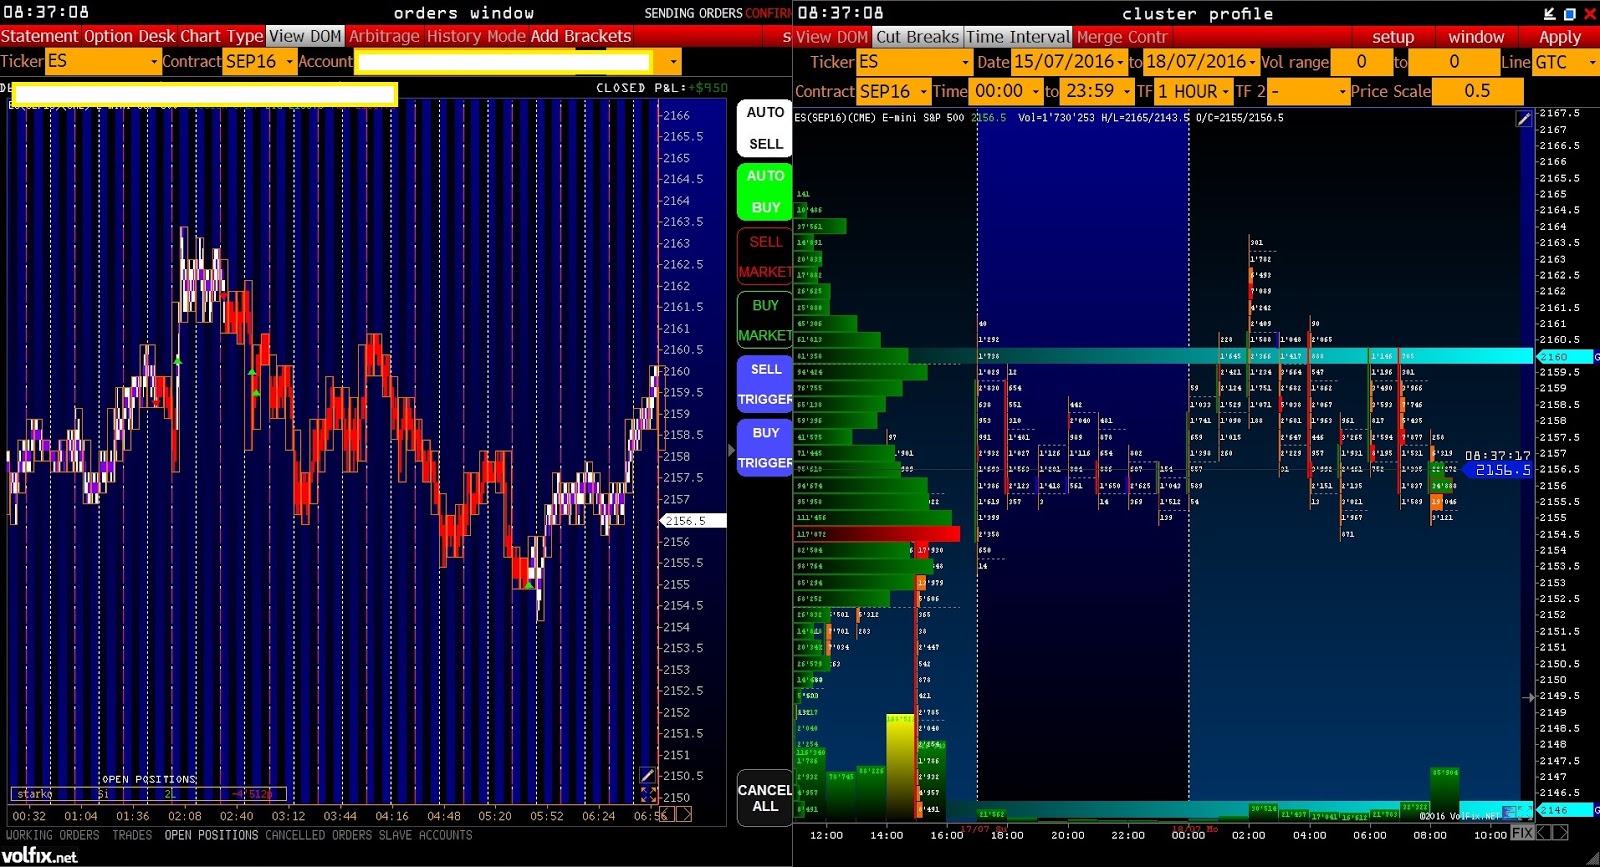
If you use the market profile, then for you are also suitable method of using the horizontal level the accumulation. Working within the day you can open  position from these levels. Using them as support and resistance levels. With Volfix.net program you can find a very precise input and output examples. If you can see local splash of  volumes - this will allow you to open and close positions as accurately as possible.
For example look at trade on ticker ES. Short stop loss - good point of entering in market and good for exit.
Look more detail how to trade with Volfix on www.volfixtrader.com.


Very interesting presentation of Dan Gilbert on TED Talks. Together with Daniel Kahneman I consider them one of the best modern scholars studying probability. They are explaining very simple  how best to use it. And also give many examples of how a lot of peoples  incorrectly decide. It will be very useful for all traders. If you use the market profile you already have a statistical advantage. In order to calculate likely do not need to be a good mathematician enough if you have the logic and you know simple formulas.

Enjoy the performance!


четвер, 14 липня 2016 р.

When we talk about methods of analysis of price movement. I prefer use volume analysis. Based on theory of Market Profile by Peter Steidlmayer a trader on Chicago Board of Trade. It is very useful method but too limited in my opinion. To develop this method we created a program Volfix.net which increase possibility of market profile.
Firstly we understand that sometimes there are big splash of volume within a day. Why we add a specific modules in our platform like Claster Profile, Claster Chart . Where we can see not only distribution and accumulation of volumes but strong splashes of volumes in short time. Often these short splashes more important than general accumulation. Look at the picture. You can see big short splash of volume at the bottom. And price movement was stopped by volumes. And price reversed.
These examples and a lot of others you can read on our official site www.volfixtrader.com.